Hi, I’m Darren 👋
I'm a New York based Product Designer (UX/UI) with 6+ years of experience designing for e-commerce, and retail. I’m interested in using to design to empower local communities and promote economic opportunity.
How I designed a 0 → 1 labor forecasting tool for store managers that drives $2M in annual labor savings
Albertsons — I designed AcuForecast, a sales and labor planning tool for store managers to schedule effectively to increase labor savings.
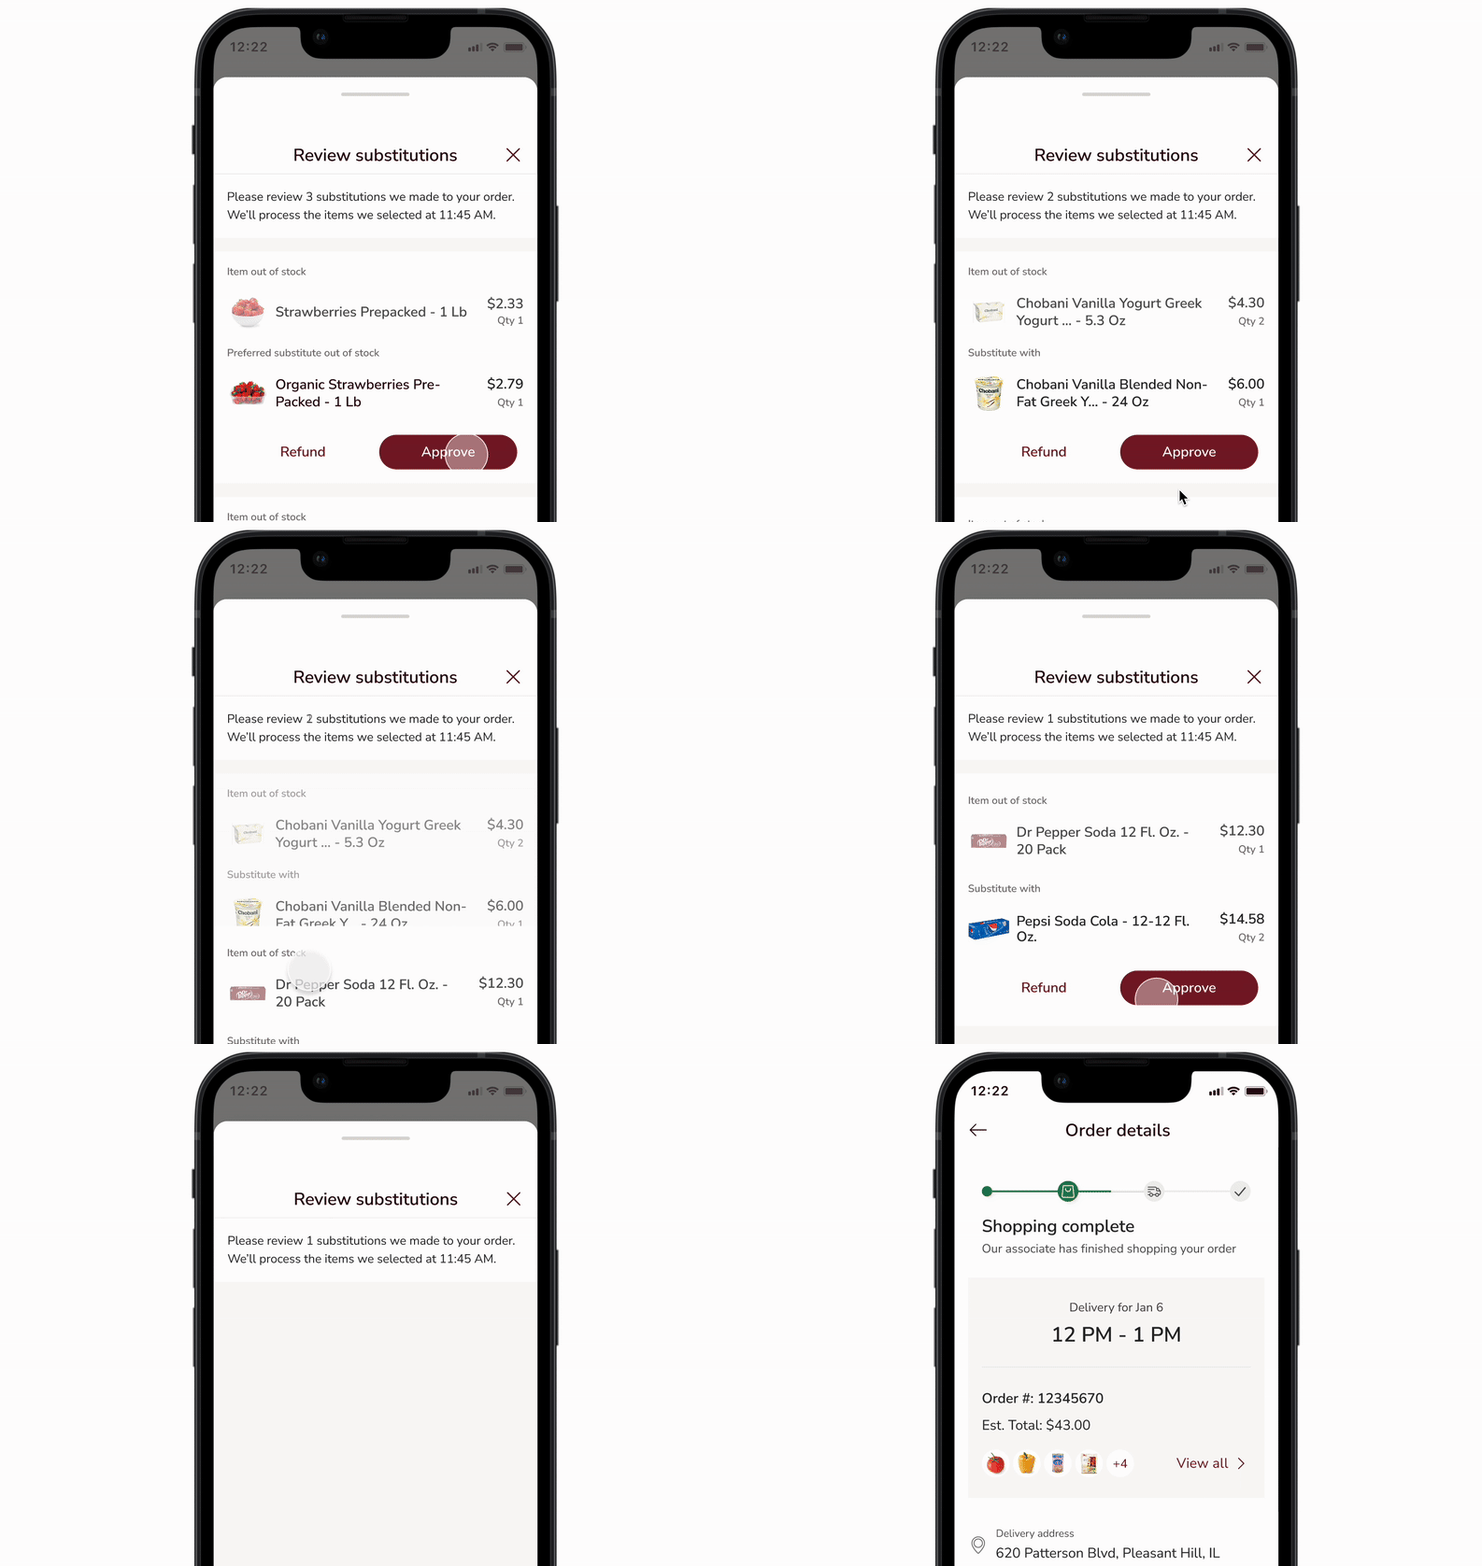
How I designed a substitutions feature that reduced customer service contacts by 68% resulting in $600K annual savings
Albertsons — I designed a post purchase substitution experience which led to increased customer satisfaction, and decreased calls to our call center.
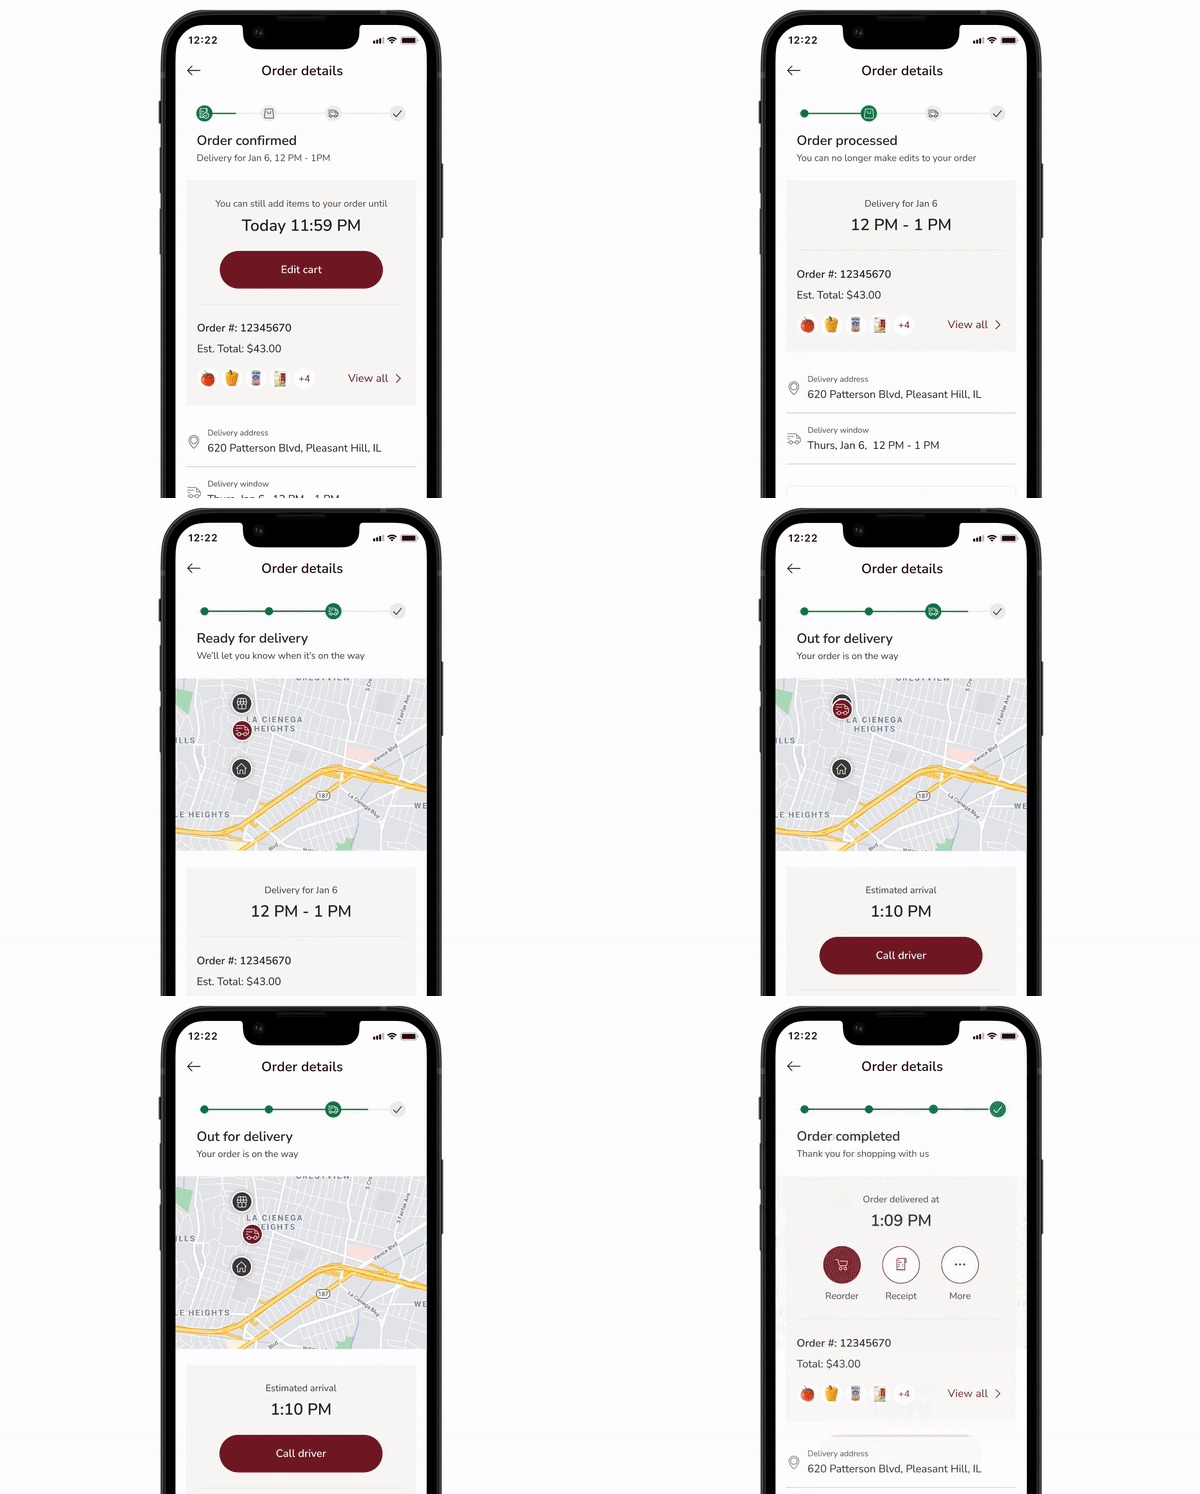
How I redesigned the post purchase experience to reduce customer service calls by 42%
Albertsons — I redesigned the post purchase experience that was released to 2,300+ stores, by communicating the customer’s grocery order status after their purchase to increase traffic and customer retention.
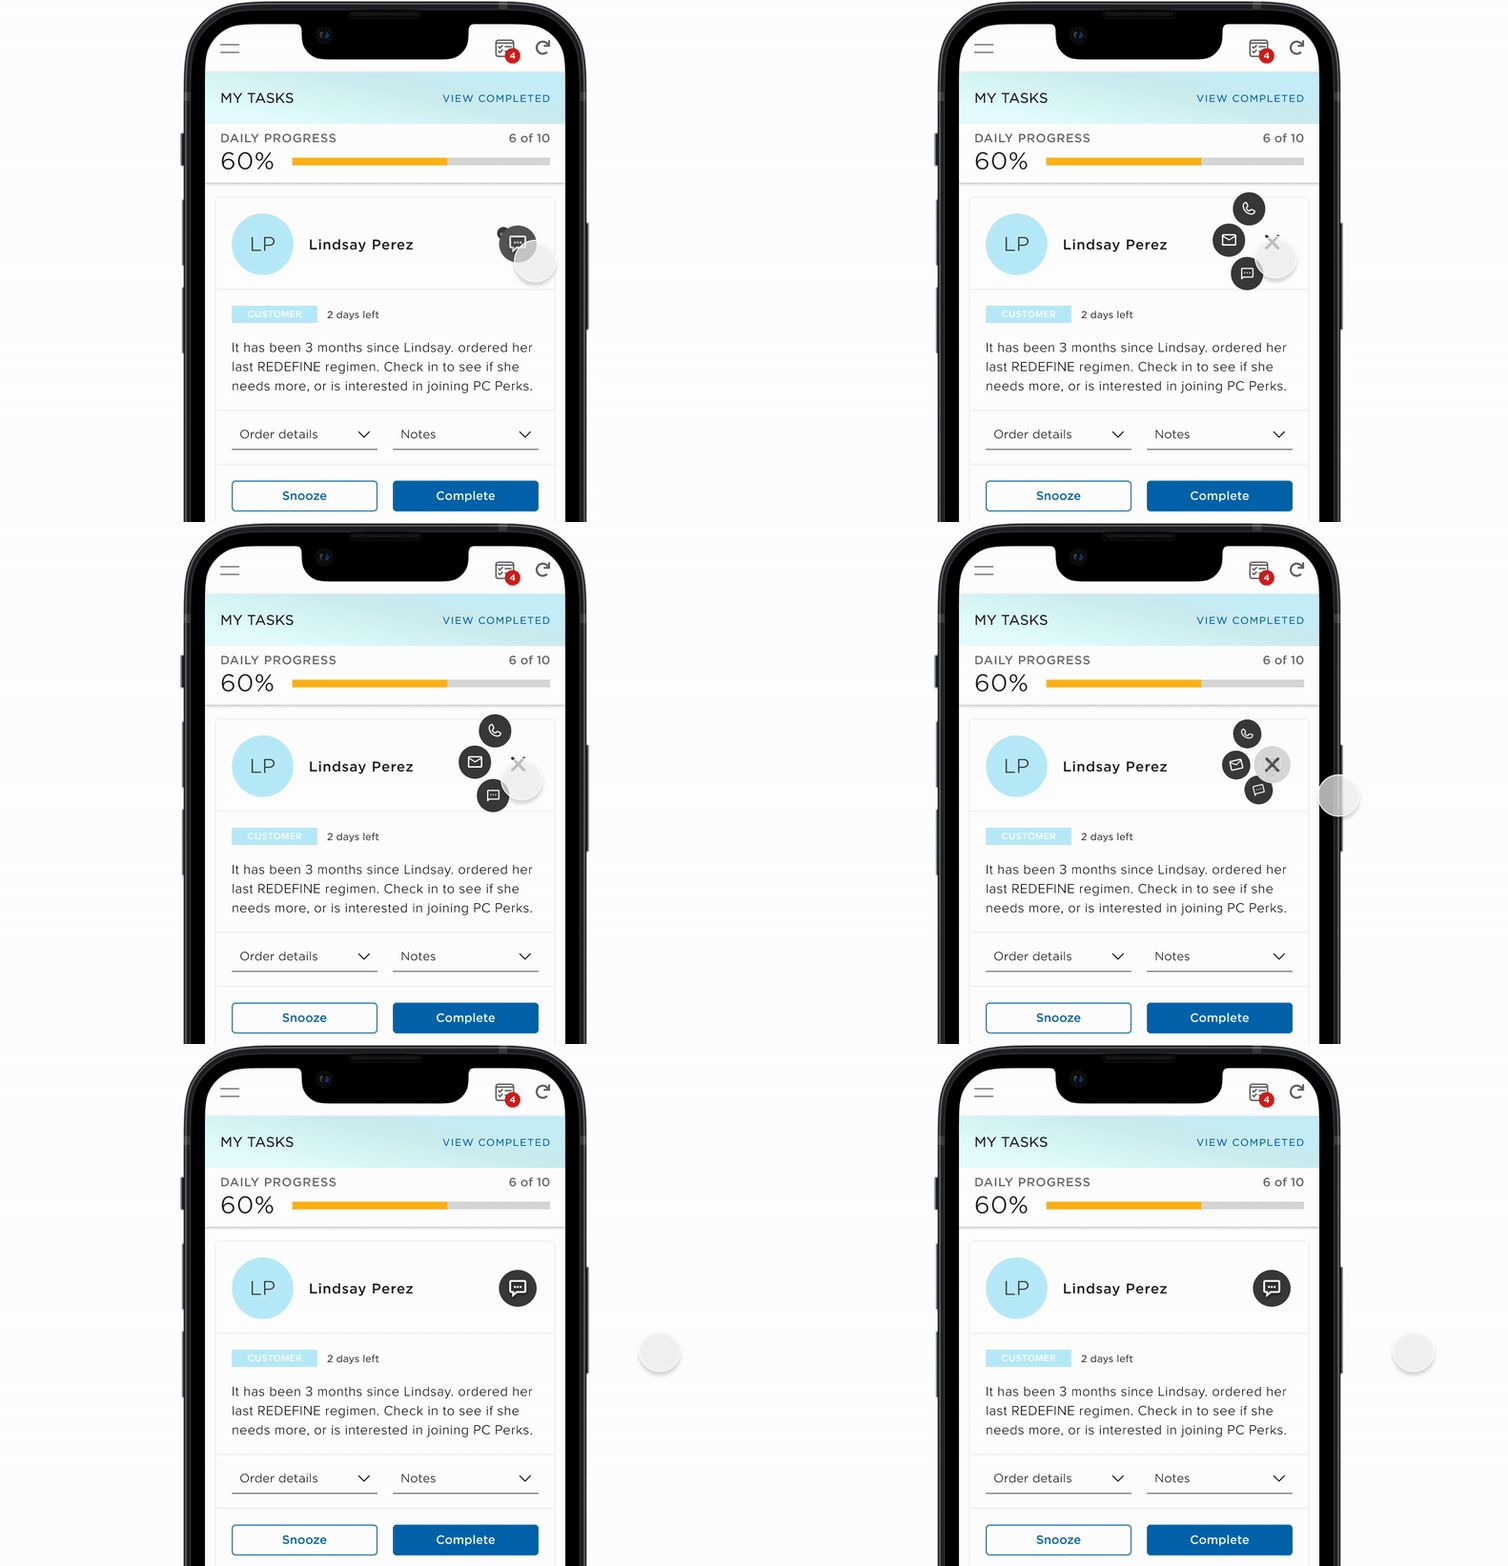
How I improved usability by 40% to help +350K sellers scale their businesses
Rodan and Fields — I redesigned the task completion experience to help business owners identify high priority tasks to increase conversions.
Other Work I’m Proud Of
I’m always looking for new ways to grow as a designer through using new technology to optimize my design process, and freelancing to explore new visual mediums.
How I used AI to design a SaaS dashboard for recruiters
Resource.IO | This was originally a project I completed with a team of 3 Product Designers. I used our insights, and our research from that project and redid it with AI to see where I could use AI to optimize my process.
How I designed the brand identity for a Michellin star dim sum restaurant in San Francisco
Palette Tea House | I got the opportunity to lead the brand design for a dim sum restaurant in Ghirardelli Square. I designed all graphical assets including the logos, menus, physical signage, as well as promotional posters.


