HTML
CSS
Javascript
Data Visualization — Prototyping in Figma & Code
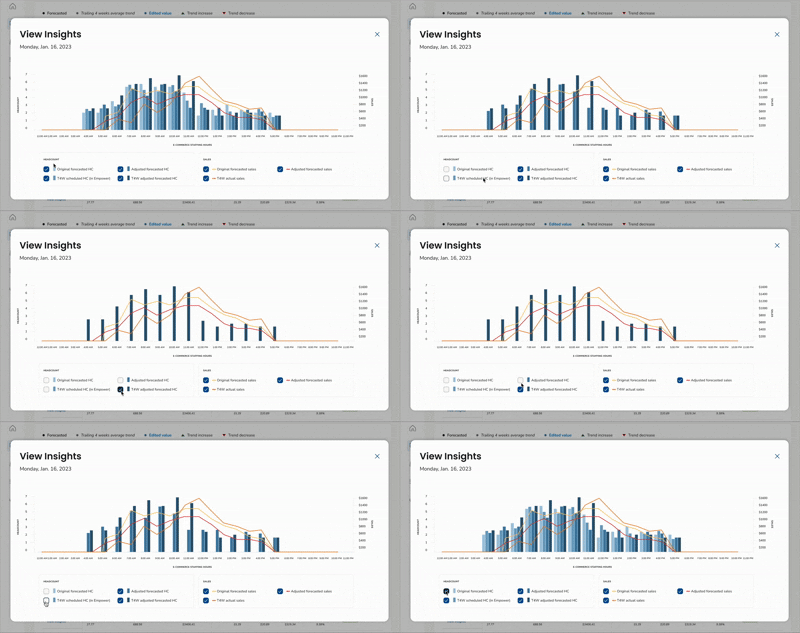
Albertsons — Bar Graph Animation
An interactive prototype used to portray the type of interaction I wanted to use for the AcuForecast Visualizer project.
Albertsons — Line Graph Animation
Interactive data visualization used in the AcuForecast Schedule Visualizer Project.
Resource.IO — Dashboard Data Visualization
Each graph has a loading animation. The pie graph is interactive, and allows the user to adjust what campaign data they see. View in Full Screen and press (R) to reset the animation.


