Albertsons
Sr. Product Designer
May '24 to Feb '25
Schedule Visualizer — Using Data Visualization to Increase Adoption

Project Summary
How do we increase organic user adoption to our new AcuForecast tool?
Approach
By redesigning a tool they already use (Empower), with new insights, and embed it in AcuForecast, we can make AcuForecast a one stop shop for their labor planning needs, which will make them more likely to use the streamlined experience.
- User Research: understand what features users want in order to use AcuForecast more.
- Synthesis: brainstorm possible solutions with Project Manager, and map out timeline.
- Iterative Design: ideate designs, while aligning with Dev on technical constraints.
- Test & Learn: conduct usability tests to validate our design decisions.
Cross Functional Leadership
- Collaborated with Product Manager to plan project scope for the project and future releases.
- Aligned with Engineering propose data visualization libraries based on future cases.
- Worked with User Research to run moderated usability tests and use qualitative surveys to collect user feedback.
Impact
Schedule Visualizer did not perform well on release. Our product's approach was to design the most complex version, and scale it down when we gathered user feedback. I stated that this would not solve for our adoption rates because we were making assumptions on what the users wanted rather than listening to them.
Upon release, we received decreased satisfaction and ease of use scores. Our next steps are to scale back the design based on user feedback. I understand there's value in designing for the user need from the beginning, but it was not possible due to our limited bandwidth.
- 10%
ASAT score measured from user surveys
- 16%
Users reported the experience was difficult to use due to information overload.
Neutral
Our researcher's survey reported majority of users (~60%) were neutral, or indifferent towards the experience.


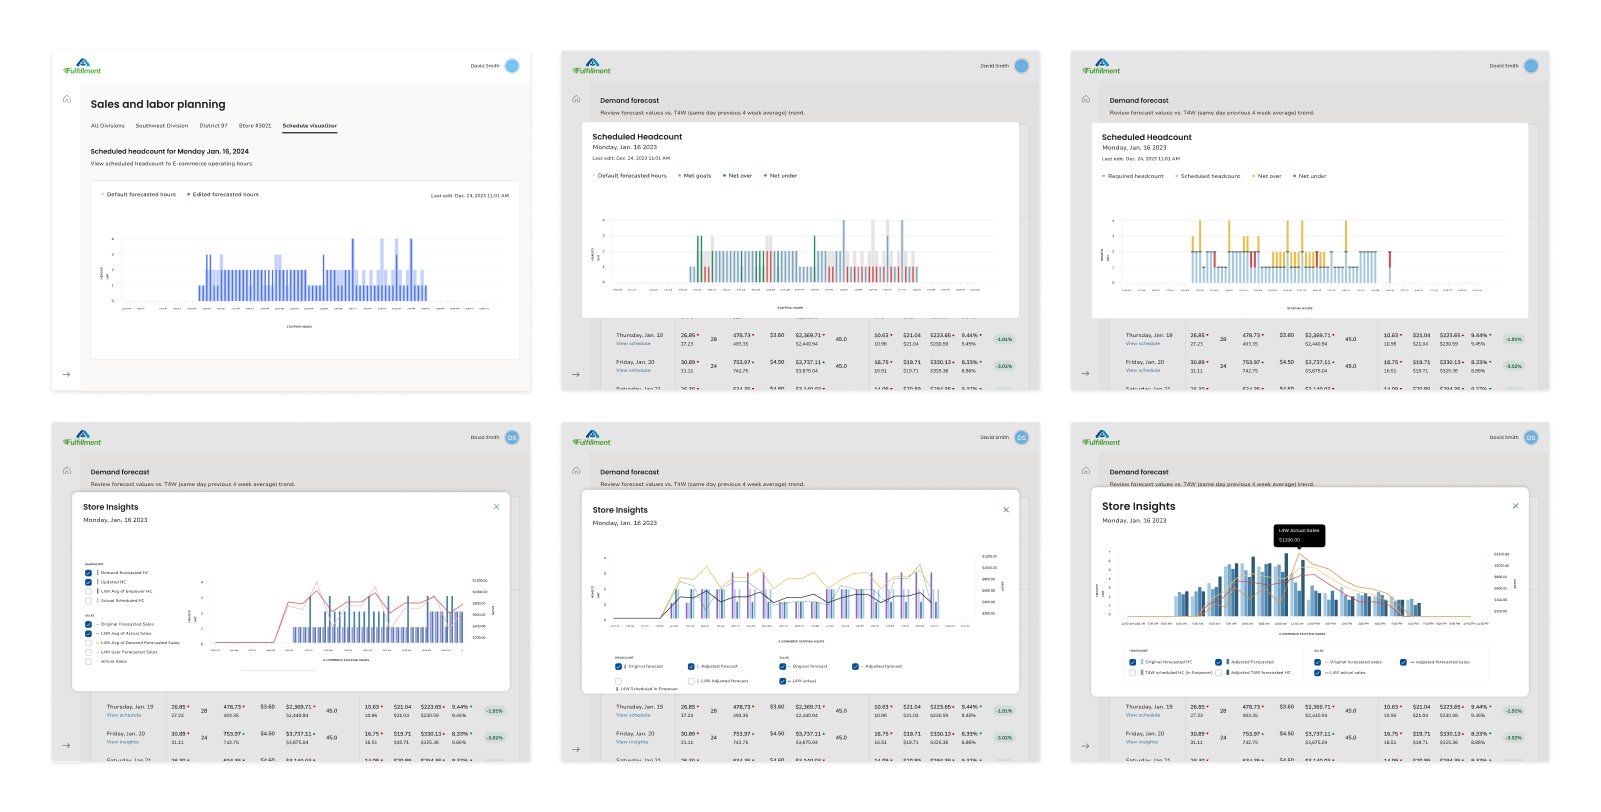
Bar Graph Interaction
I designed a prototype to showcase the expected animation that our developers could mimic in chart.js.

Line Graph Interaction
I designed a separate line animation prototype. Separate prototypes was the best option to showcase the concept within the time we had.